
Looking to get hired.
Greetings to you! I am a graduate from the Memorial University of Newfoundland in the Department of Computer Science.
In computer science, my interest is in data visualization. If physics can be bifurcated into two parts - classical physics and modern physics, my interest is in the classical. As you scroll down, you will see a few projects, either done in a group or individually by me, that reflect those interests.
For any of the group projects mentioned in this page, I do not expect anyone to be credulous enough to believe my contribution from my mere words. In that case, the commit history of the repository should corroborate the veracity of the claims I make about my contribution to a project.
Although I had no intention to equivocate, if the description of any of my projects seems equivocal, please contact me for clarification. My contact address is at the bottom of this page.
Check out my biggest Python project till now, where I tried to implement almost all my concepts about the Tree data structure. It has an exponential runtime but ensures optimal solutions -unlike genetic algorithms for which I prefer Java. The tree in the project was written from scratch and I am not sure if Python offers a built-in tree, but there are many built-in data structures that can be used by importing different Python libraries. One of those libraries is pandas which I use for dataframes and series. A few projects I made while using pandas are:
- gistemp
- Visualised data from Nasa to histograms.
- Used two matplotlib modules for the histograms:
- pyplot (the most common matplotlib module)
- colors
- Cary
- Visualised three datasets about the town of Cary of North Carolina in one notebook.
- Interestingly noticed that Cary Arts Centre is not counted as a point of interest. Why?
- pca
- In February 2024, I came across a paper in ReasearchGate Evaluation of Breast Cancer Tumor Classification with Unconstrained Functional Networks Classifier and tried to recreate the Figure 3 and Figure 5.
- While trying to recreate Figure 3 I discovered that the axes are mislabelled - neither the x-axis represents the Mean Radius, nor does the y-axis represent Mean Texture. Instead, if I take x-axis to represent mean texture and y-axis to represent mean perimeter, my figure looks the same as their figure-3.
- When it came to Figure 5, I completely lost what exactly they did with the data. Firstly, smoothness can never be negative.
Secondly, if you look at the data and take a peek of the smoothness columns, smoothness tends to be between 0 and 1.
In contrast to them, Figure 5 'worst mean smoothness' has a higher range and can have negative values.
My guess about what they did is that they plotted the scaled values of the smoothness_worst column in the z-axis.
- But even with the scaled values, a z-limit of -3 to 4 should be enough. Why did they choose to extend it to -4 to 6?
- Also, why are x and y axis plotted as original data, but z-axis as scaled data? If one says that it is because smoothness_worst has too low range, I would say that area_worst has too high range.
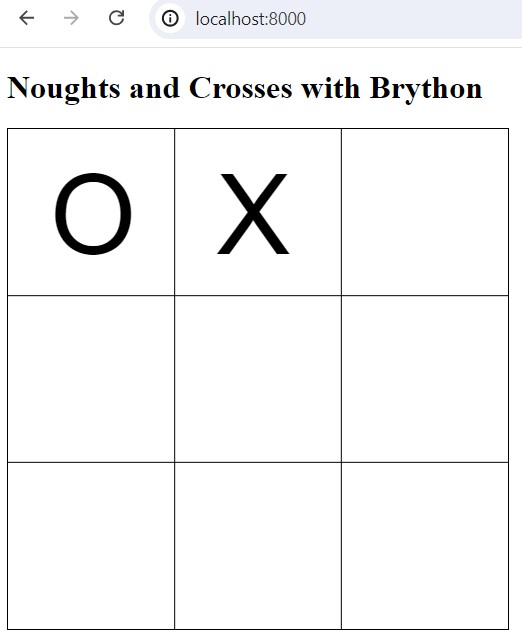
Tabannum and I developed a tic-tac-toe game using the Brython library of Python. This project is available upon request only, so please feel free to contact any of us. My contact information is at the end of this page.
I have written search algorithms like BFS, DFS, A*, IDDFS without any use of recursion, using Javascript. However, they are just the rough algorithms and cannot be implemented (you cannot simply download and run the repositories) since the environment (or map), configuration etc. that these algorithms require as inputs, have not been written by me and so are not there in the repositories.

I built this Python-based system to elucidate abstruse computer vision topics, like camera calibration and pose estimation, using OpenCV Contrib 4.8.1 (any other version of OpenCV may be incongruous with the system). The system is augmented with auxiliary image processing tools for autonomously cropping, resizing, undistorting, converting raw to color, converting color to grayscale and converting grayscale to binary.
Go to the repository Project page
If you want to see a Javascript project that you can run - or may I say, "play" - Zawad Mutawassit and I, in a project called "ProjectAI", developed a game which we informally call "FishFrenz". Instructions about how you can interact in the game is provided in the README. The game does not contain any GUI: when the game ends, the program crashes, but you can restart the game by simply reloading the browser where you are playing.
FishFrenz story: It is a snowy night. Your enemy - the crocodile - is trying to eat your fish friends. The fish are capricious; they take erratic turns in every frame; you can never be sure which direction a fish will be travelling. The voracious enemy targets one of the fish in the water. The truculent crocodile will breach the border of the territory of fish because the direction of the targetted fish is the catalyst that gives the enemy its direction of motion. The enemy thinks that because it is hard to see in snow, let alone at night, it cannot get shot by you, so it will succeed. Only your winning can disabuse the crocodile.
Go to the repository Play FishFrenz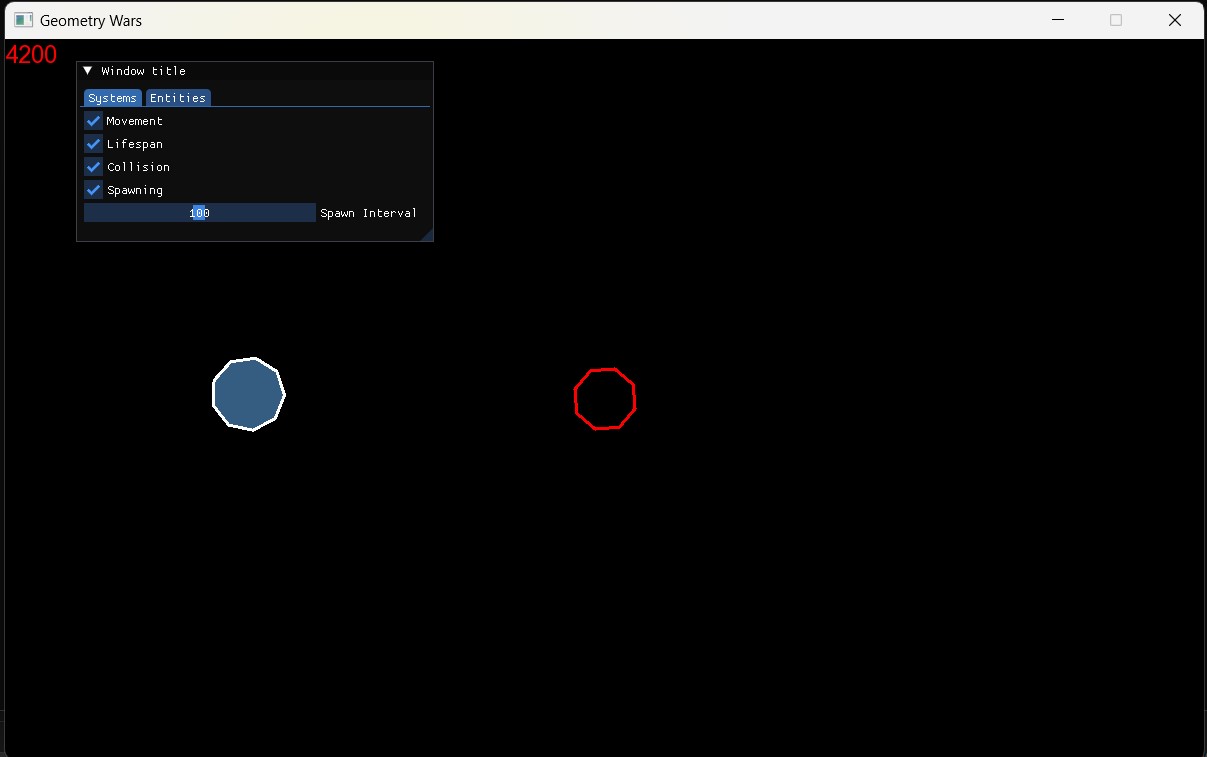
Github user Catalina430 created a game analogous to the top-down multi-directional shoot 'em up known as Geometry Wars. When I found that his project was made using SFML, the same library with which I made my first C++ project, I worked on it with alacrity, intending to incorporate some GUIs to the game, but ended up making changes to the SFML part of the project too. I cannot guarantee that the result of the changes is better than the original one by Catalina430, maybe he would argue that I exacerbated his project, so I did not fork-and-contribute, in lieu I claimed mine to be a disparate project and named it Project Catalina430 (more details and updates about the project are in the README of the repository).
Go to the repository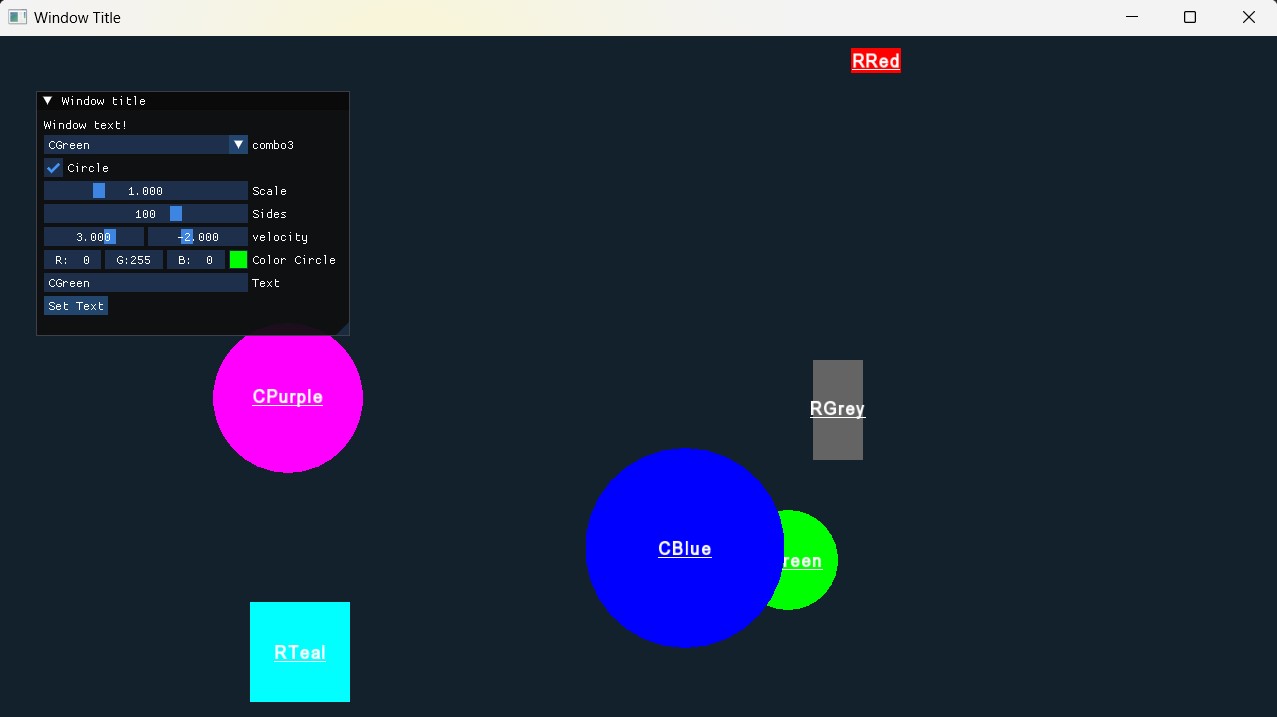
Check out my first C++ project using SFML and IMGui, inspired from a Youtube tutorial.
Go to the repository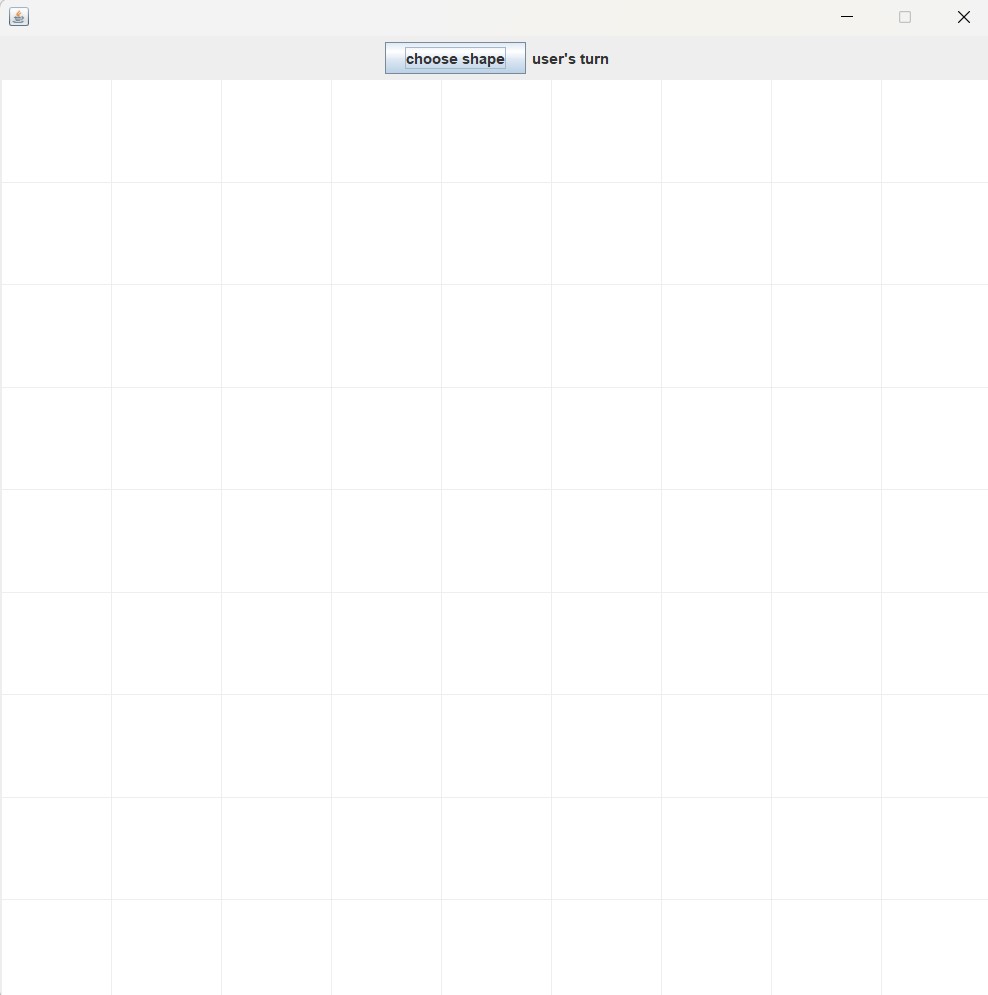
JavaSwing1
This Java Swing project allows you to fill a grid with tiles of different shapes and colors. The biggest challenge in this project was to ensure that the user cannot place a tile on the top of another - that is, there is no overlap of tiles. As long as there is no overlap, you can place your tile anywhere in the 9*9 grid. Initially, the grid is white and empty, as you can see in this image. A tile is chosen by clicking the "choose shape" button. After choosing a tile, hover over the grid to select a position (or to check if the tile can be placed in that position). Click on the grid to place your tile.
Go to the repository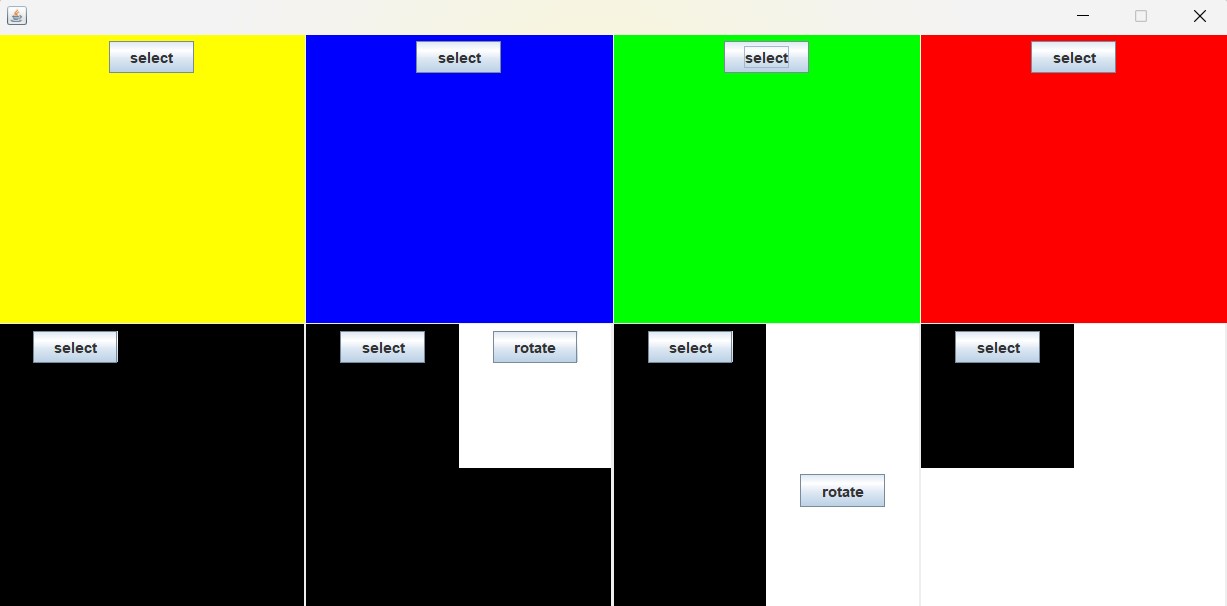
JavaSwing1
This Java Swing project allows you to fill a grid with tiles of different shapes and colors. The biggest challenge in this project was to ensure that the user cannot place a tile on the top of another - that is, there is no overlap of tiles. As long as there is no overlap, you can place your tile anywhere in the 9*9 grid. A tile is selected using the interface you can see in the above image. The orientation of a shape can be changed using the "rotate" button on it. Intuitively, "select" buttons are to select a shape and color. Once a shape and color is selected, you will be taken to the grid where you can place the tile of your selected shape, color and rotation.
Go to the repository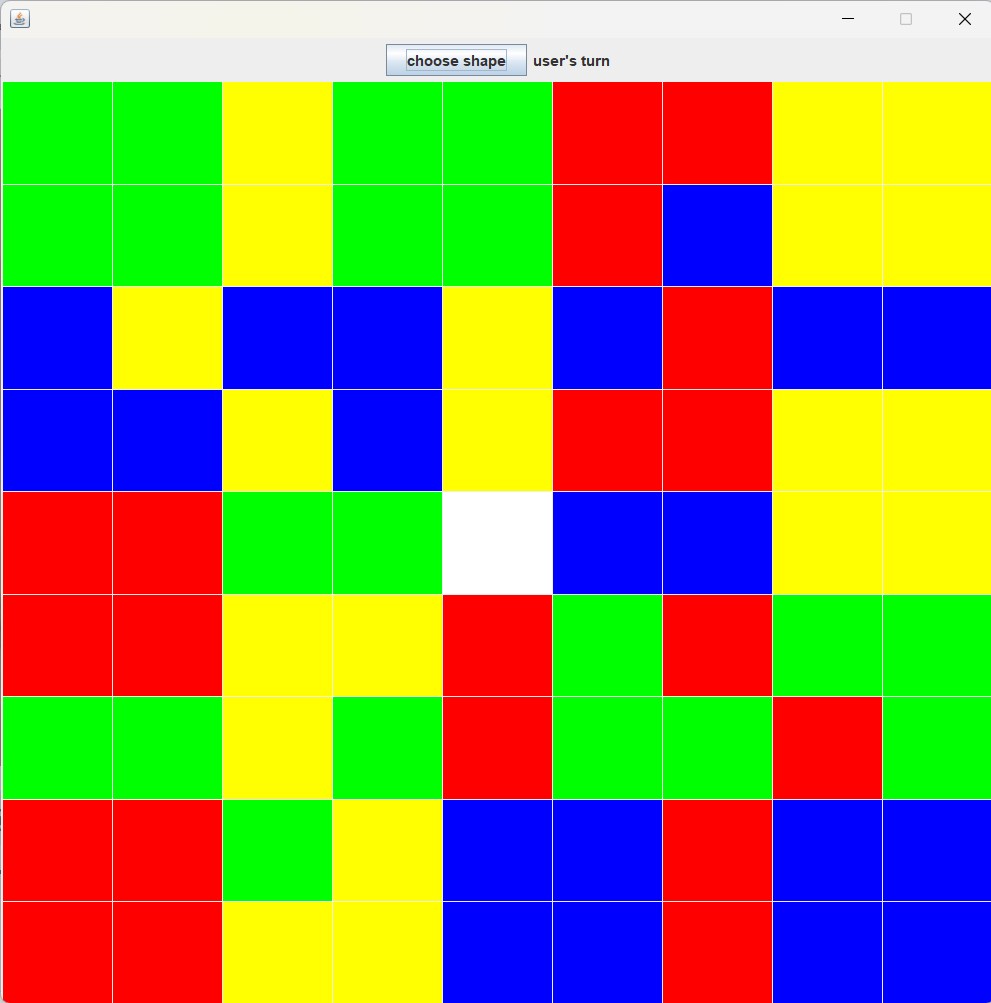

Summary of Qualifications
With a strong foundation in modern web development, I specialize in building dynamic, responsive applications that deliver seamless user experiences. My expertise includes crafting interactive front-end solutions and leveraging powerful data analysis techniques to extract meaningful insights. I thrive in developing computer vision applications and implementing machine learning workflows to solve real-world problems. Whether it's designing sleek, mobile-friendly interfaces or processing complex datasets, I bring a versatile skill set that bridges the gap between data science and practical software development. My approach combines analytical rigor with clean, efficient coding practices to create robust solutions across different domains.


 Send email
 Connect with me on LinkedIn